Introduction
One of the biggest concerns related to cloud costs is the inefficient use of resources and the cost impact of underutilized resources on cloud spending.
RealTheory not only provides near real time visibility into potential wasted cost at every level of your Kubernetes environment by enabling deep dives from the cluster level to each individual object, but can also provide insight into how to remediate issues and, ultimately, reduce those losses.
Prerequisites
To perform this procedure you must have the following:
- A user account in your organization's RealTheory account
Procedure
-
Log in to your organizational account using one of the following methods:
-
SSO (single sign-on) - if configured for your organizational account
-
Email address, password, and account name - if SSO is not configured
Note: If you are unsure how to complete this step, contact the system administrator for your RealTheory account.
-
-
Navigate to Reports > Lost Dollars.
-
Verify that the breadcrumb filter is set to Reports > Lost Dollars > Clusters.
This view will give you results for all clusters that you are authorized to view so that you can quickly identify which cluster might provide the best opportunity for waste reduction.
-
By default, the period selector will show the losses for the last 7 days; you can change the time period to 24 hours, 31 days, or 1 year if the 7 day time period is not appropriate.
-
Use the Cluster column to identify each cluster; the cluster at the top of the report is the cluster that is wasting the most money for the selected time period.
-
Double-click the cluster of most interest.
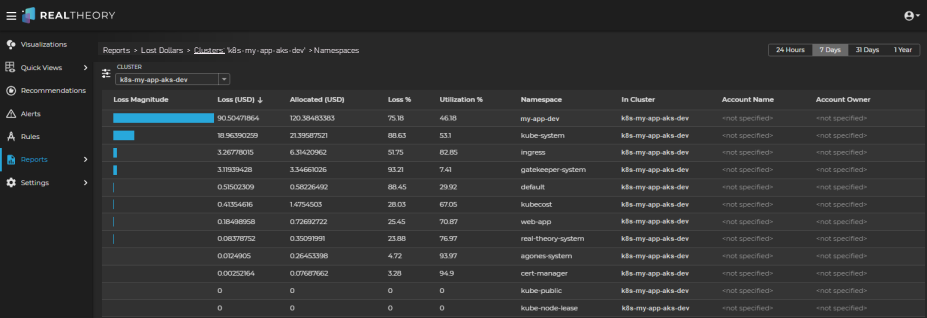
The report will list the namespaces from most waste to least waste for the selected cluster:
-
The high losses for the my-app-dev namespace combined with its lower Utilization % indicates that investigating this namespace could yield important insights.
-
Double-click the namespace row of most interest.
The report will list the deployments from most waste to least waste for the selected cluster and namespace: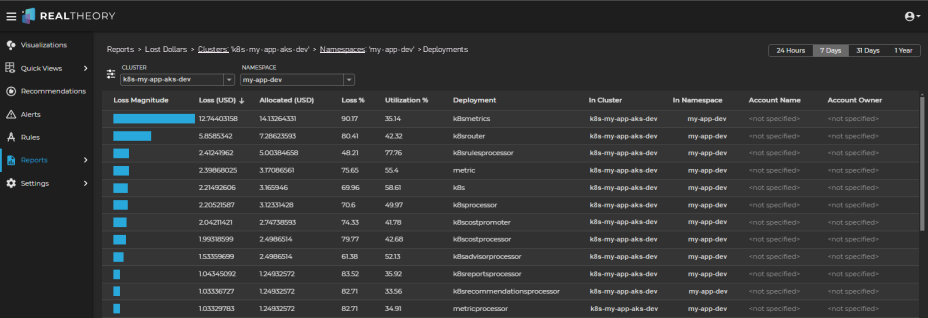
-
Focusing on the deployments with the highest loss magnitude, review the Utilization % column for each.
Deployments with a higher loss and a lower utilization might indicate that there are opportunities for reducing losses. -
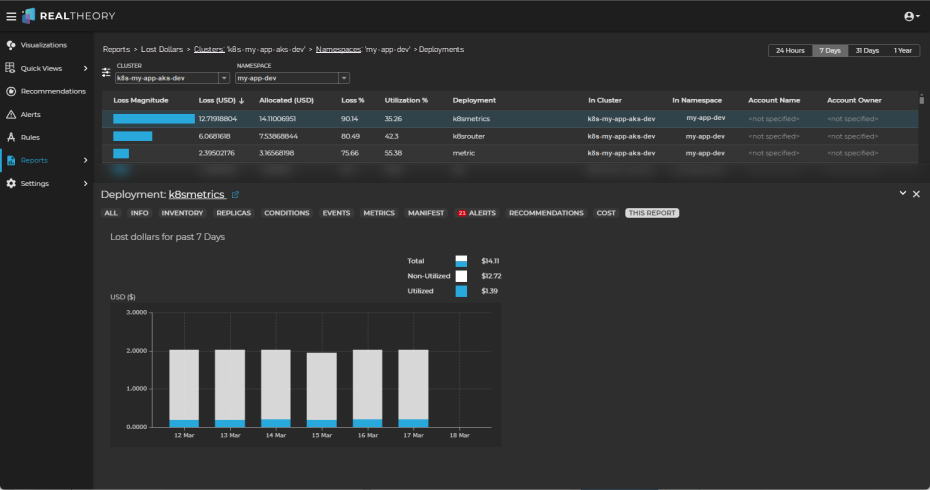
To gain more insight, click on the row for the object of most interest.
This will open the Information Panel and display the This Report tab, which shows the Total, Utilized, and Non-utilized costs associated with the selected object for the selected time period:
-
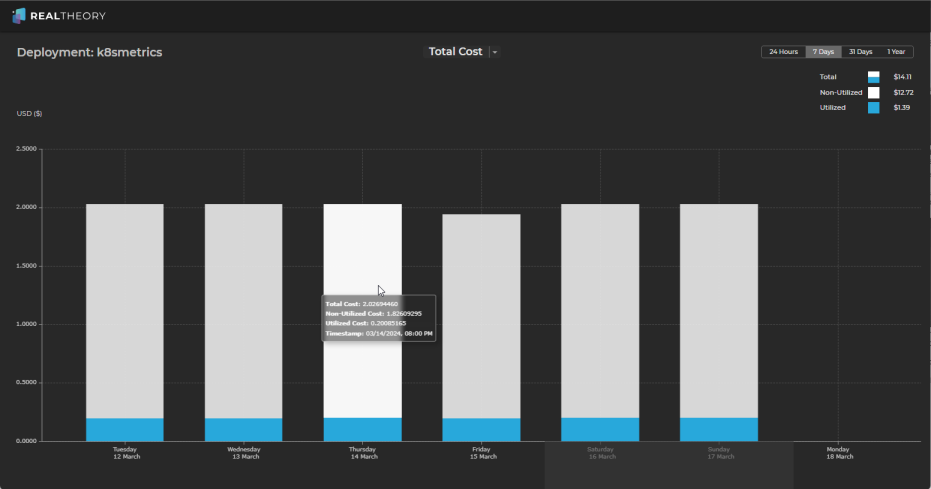
Click on the chart to open a full size version of the chart where you can interact with the different aspects of cost-related data as follows:
-
Total Cost - Total, utilized, and non-utilized costs for the object:
-
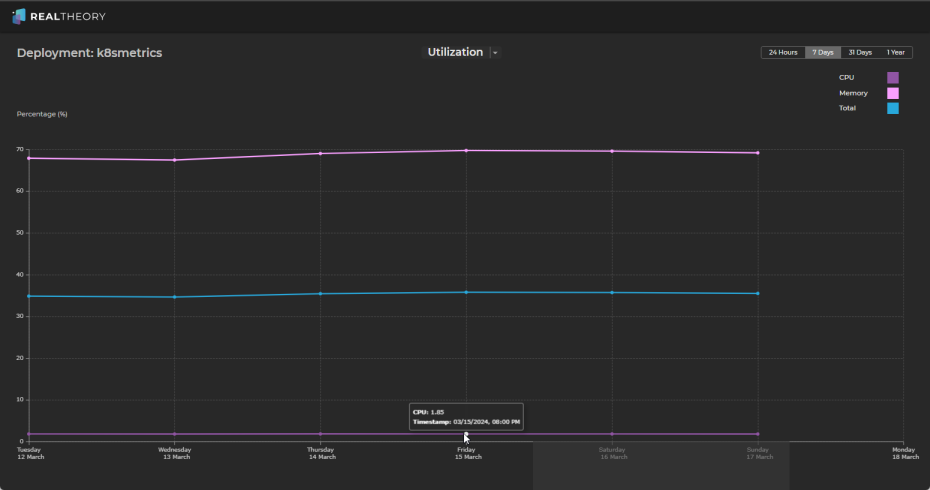
Utilization - Total, memory, and CPU utilization for the object:
-
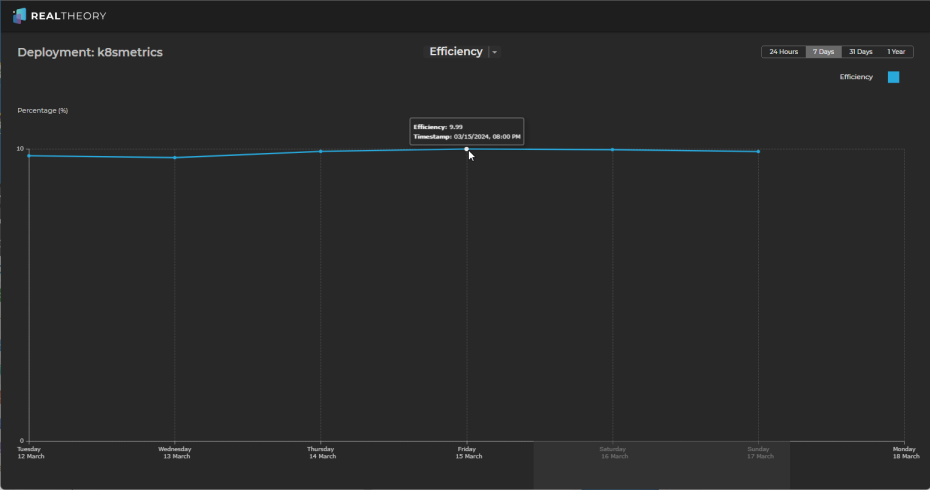
Efficiency - a cost-weighted analysis of the utilization of the object:
-
-
From these charts, we can see the following:
-
CPU utilization is around 2%
-
Memory utilization is around 65% - 70%
-
Total utilization is around 35%
Which results in an efficiency (cost-weighted utilization) of around 10% for the last 7 days.
-
-
You can use the other time periods to review historical data and identify usage patterns, peak loads, and times of underutilization to gain more insight.
-
By reviewing the charts, we can see that workloads associated with this deployment are probably well provisioned on memory but are possibly overprovisioned on CPU; however, as the cost of CPU is significantly higher than the cost of memory, we have quickly identified a possible opportunity to reduce wasted cost associated with this deployment.
-
Further investigation is likely warranted to confirm that the CPU is overprovisioned, but within a minute or less, you have valuable insights into why this cluster has the most wasted cost.
-
You can also examine other tabs in the Information Panel on the deployment report view to gain additional insights.
-
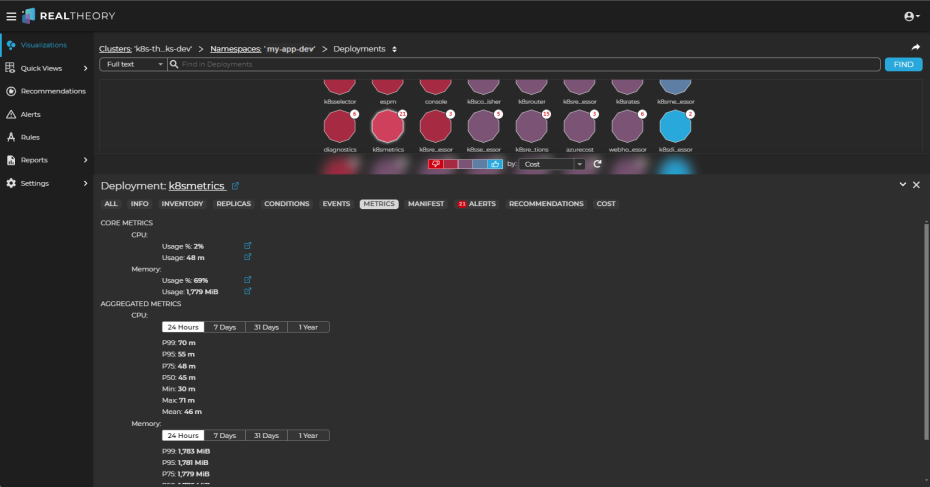
If the analysis of the deployment identifies an issue of interest, click the deployment name link in the Information Panel to view the deployment in the visualization:
-
Double-click the deployment (it will be highlighted) to drill in to its workloads and change the perspective selector to Cost to see which workloads might need more analysis:
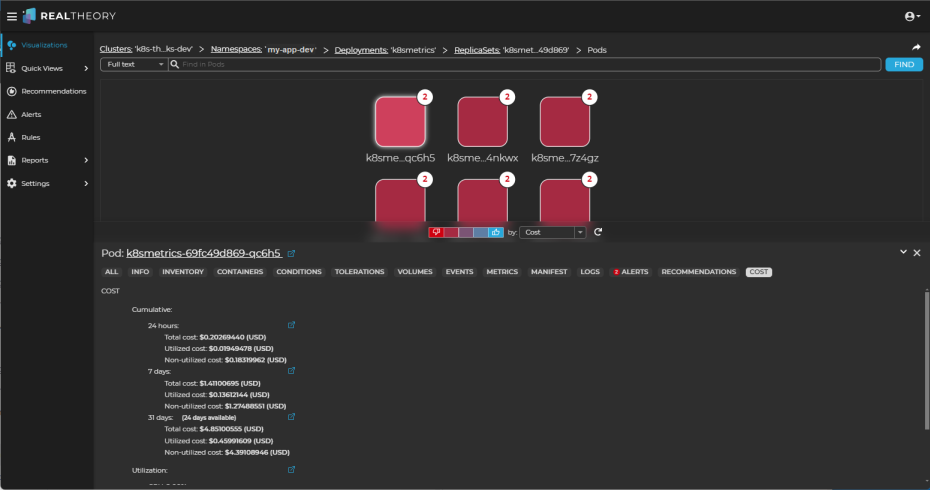
In the pod visualization, we can see that all of the pods in the deployment are under cost pressure.
-
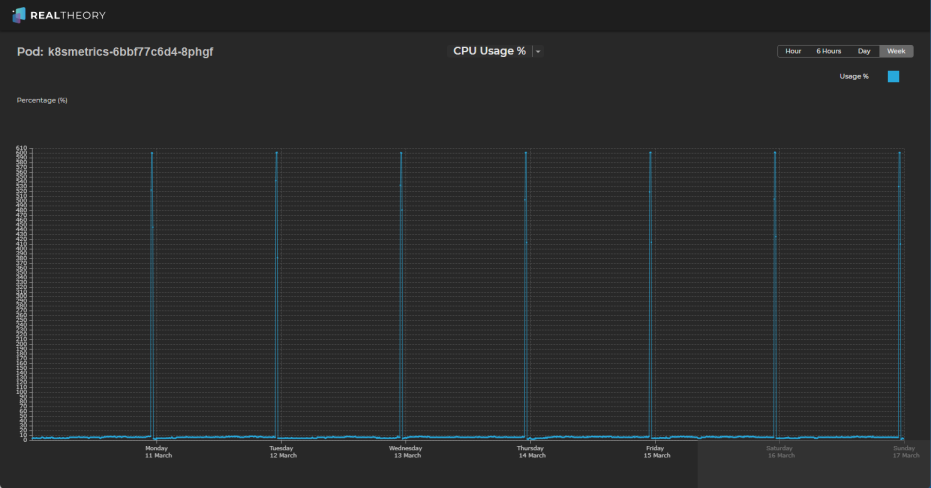
By reviewing the metrics for the pods in this deployment, we can see that CPU usage has short bursts of very high spikes (one spike each day of ~600%) but otherwise usage is around 10%:
-
This could indicate that we are spending more than necessary on resource allocation to accommodate the spikes and that there are opportunities to reduce cost waste if, for example, any of the following might be options:
-
breaking the work performed during the spikes into smaller tasks that could be distributed more evenly throughout the day
-
scaling resources dynamically using Kubernetes Horizontal Pod Autoscaling (HPA) to automatically accommodate increased demand during peak periods
-
right-sizing resource requests and limits for the pod based on its actual resource requirements during peak and non-peak periods
-
conducting thorough performance testing and profiling to identify any inefficiencies or bottlenecks within the application
-
-
If the analysis of the deployments did not identify any significant discrepancy between utilization and waste, continue your investigation by using the
 in the Reports > Lost Dollars > Deployments breadcrumb to select another object type of interest.
 -
Typically, reviewing objects in the following order will quickly identify where opportunities to reduce cost waste exist:
-
ReplicaSets
Note: You can also double-click the deployment row of most interest to list the replicasets for the selected cluster, namespace, and deployment. -
StatefulSets
-
DaemonSets
-
-
If, after reviewing the charts and the Information Panel tabs for these objects as you did for deployments, the utilization of each object is within an acceptable range, a review of the nodes might determine if the wasted cluster costs are related to overprovisioned nodes.
-
In the breadcrumb, click Namespaces and then use the
 to select Nodes.
 -
Repeat the waste-to-utilization analysis of the node with the highest waste magnitude in the cluster.
-
If node utilization is within an acceptable range, then the waste magnitude might simply reflect the cost of ensuring reliability and continuity of operations, which can result in some degree of resource waste. No immediate action is needed, but monitoring should continue.
-
If node utilization is not within an acceptable range, you might have too many nodes running or scheduling constraints that prevent pods from being scheduled to a node; consider the following:
-
Review the scaling policies configured for your cluster and, if necessary, adjust the scaling thresholds and policies to better match the workload requirements
-
Review the distribution of workloads across the nodes in the cluster and consider rebalancing workloads or adjusting pod scheduling and affinity configurations to distribute workloads more evenly across nodes
-
Evaluate the resource requests and limits set for pods running in your cluster and adjust resource requests and limits as needed to prevent overprovisioning of resources and to optimize resource utilization across nodes
-